http://www.ems-usa.us/products/hinged-doors/
1) Installation
• EMS Doors come Completely Assembled with Hardware and Hang in the Frame.
• The Two Piece Frame Allows for a Quick, Easy Installation
• Frames are Custom Designed Based on the Application Needs
2) Sealing
• Exclusive Cam Hinge Design Allows for a Seated Seal
• Cam Hinge Creates an Even Pressure Around the Perimeter Seal and Panel
3) Panel Strength and Alignment
• EMS Uses a 10# Foam as Standard
• Very Dense Insulation Provides Better Dent Resistance
• No Exposed Fasteners
4) EMS has a Variety of Finishes and Panel Options
• Unique Stainless Panel with a Circular Finish with Other Stainless Steel Finish Options
• Varied Colors
• Polished Fiberglass
• All Hardware is Stainless as Standard
• Frame less Insulated Windows are Optional
• Casing Match Panel Finish
5) EMS Doors are Completely Cost Competitive
6) Low Maintenance
Monday, November 28, 2011
The Construction Market Landscape
The Construction Market Landscape
Written by Doug Bevill, President of Construction Economics & Strategies, LLC. Since the crash of 2008 there have been many opinions offered as to how significant the correction in the construction industry will be and when it will return to the levels we enjoyed from 2004 to 2008. The short and factual answer is that the construction industry has taken its worst hit since the Great Depression. This hit has led to significant shifts in channel behaviors, which can be attributed to the evolution of the new economic landscape in the construction industry.To put things into perspective, it is important to understand just how much the industry has constricted and how this ever-constricting market is impacting behavior in the AEC space. In 2006, residential construction spending reached its peak of $6.9 billion. Then, in 2007, the housing market started to show the results of the subprime lending practices of the past several years. We all know how this ended up playing out: with the world teetering on the edge of a global economic crisis at the end of 2008, mainly due to a massive housing and commercial real estate bubble.
Residential construction continued to lose ground in 2008, ending at a total of approximately $2.8 billion, a staggering loss of over $4 billion. However, that was only the beginning. In 2009, the construction of commercial properties came to a screeching halt as property values dropped and banks found they were unable to lend due to the mounting toxic assets on their books. Below is a graph showing the decline in spending on residential, commercial and institutional buildings with a year-to-year percentage change.
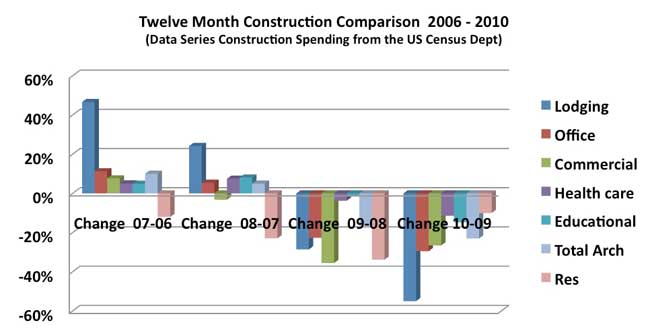 Please note the steep declines in lodging, office, and commercial/retail for 2009, which further deepened in 2010. During 2009 the construction of healthcare and educational projects (the largest architectural sectors) held their own. However, as unemployment spiked to 10-plus percent in 2009, the reduction in income tax revenue left municipal, county and state funds stressed, which led to the gradual but prolonged slowdown in institutional construction. 2010 was the worst year for commercial and institutional construction spending, surrendering just short of $700 million compared to 2009, which was a bad 12-month stretch on its own, surrendering $695 million or 17 percent compared to 2008.
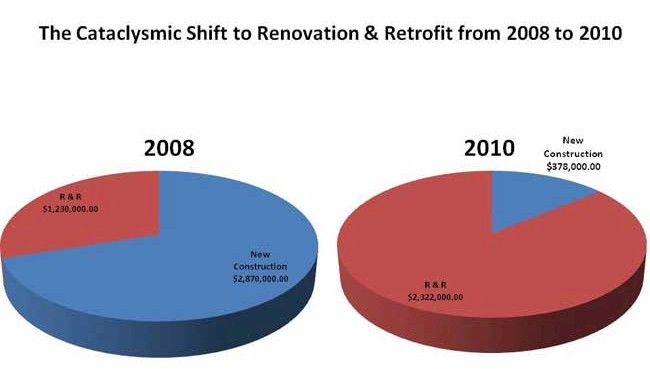
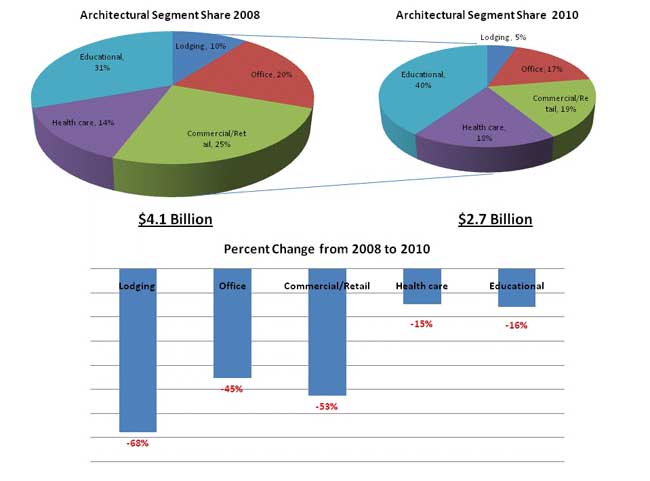 As illustrated above, the architectural market has lost thirty four percent since 2008. What is more, the pie charts show that the share of income properties (lodging, office and commercial/retail) dropped from 60% of total construction spending to only 40%, while institutional building (healthcare and educational) grew from 40% to 60% of total spending. Naturally, those serving the institutional market were impacted far less severely during this time than those focused on income properties.
Where We Are Related to 2006
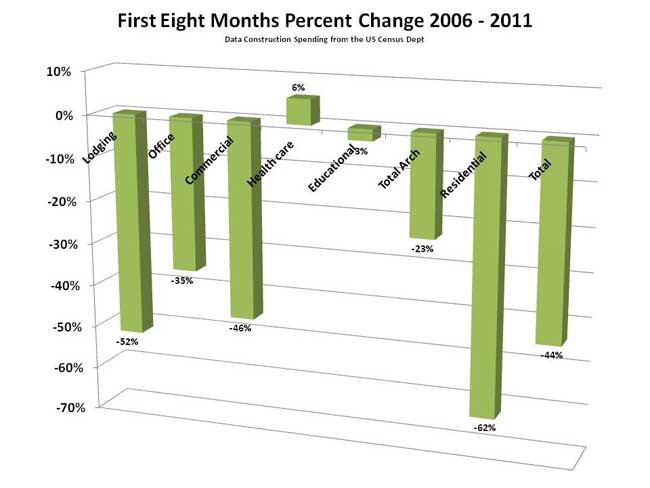
The chart below is comparing the percent change in construction spending with the first 8 months of 2011 with the same period for 2006. This is what I term a snapshot analysis; it is useful in product benchmarking and market analysis. This graph clearly illustrates how much value is still being lost through August of 2011. The exception would be 6 percent growth in the healthcare segment. Healthcare related products and services are one of the few areas that still continue to grow in the current economy and the construction of healthcare-related buildings is no exception. The largest segment of the US population is the Baby Boomer Generation, the group up of people born between the years 1946 and 1963. So the first phase of the Boomers will turn 65 in 2011, with an ever-increasing number to follow. In simple terms, there is not enough square footage in necessary healthcare-related buildings to serve this growing population. As a result, healthcare construction should remain a relative bright spot for years to come.
The other area on the graph that I should explain is residential. The US Census Department groups single family and multifamily construction into this single category, which ends up making (if you can believe it) the sector look healthier than it is. Due to our current employment struggles, the increase in home foreclosures and the difficulty in getting the necessary financing for single family homes, there is an ever-increasing demand for rental-related properties, especially apartments. For the purpose of this article, I have not broken out single family housing from multifamily, but the recent growth in apartment building construction means that the numbers for single family homes are actually much worse than the negative 62 percent would indicate.
 Crystal Ball
This graph is my forecast for the balance of 2011 vs. 2010 (September through December) and for all of 2012 vs. 2011.
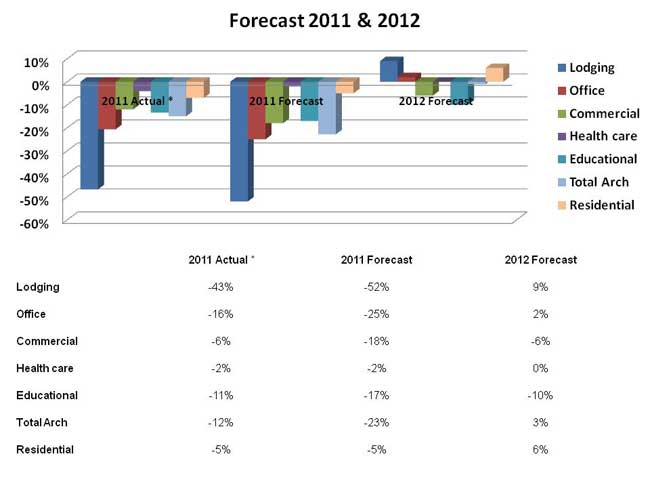 Given the trend and current economic environment, I believe that income properties will lose more ground for the balance of this year and into the first quarter of 2012. However, I do feel that there will be a modest increase in demand for lodging and office buildings. Given the current unemployment and underemployment situation, I also feel that the commercial/retail sector is still grossly overbuilt, so demand will remain weak.
Healthcare will continue to slip more in 2011 with an increasing demand in 2012 for the reason I have mentioned earlier. Again, given the weak employment situation and shrinking tax coffers, including real estate tax revenues, and the resulting budget cuts, I feel the education sector will constrict for the balance of 2011 and 2012.
| 2008 | 2010 | Change | |
| New Construction | 2,870,000 | 387,000 | -86% |
| Repair & Renovation | 1,230,000 | 2,322,000 | +89% |
| Total | 4,100,000 | 2,709,000 | -34% |
According to Kermit Baker, AIA’s Chief Economist, architectural unemployment is at roughly 25 percent, and many of those architects lucky enough to still be working have taken significant salary reductions. This is quite plausible when considering that only 14 percent of architectural spending has any need for a full set of design and specification documents. Needless to say, this fact should be a “wakeup call” for those building product manufacturers who have traditionally spent a significant amount of their time, effort and budget marketing their products to the architectural community in order to become specified.
That being said, in my opinion a building product is not a true brand unless it is consistently specified; so it is important for manufacturers to maintain their architectural, as well as specifier, strategies and relationships. However, given the tremendous shift in the design and construction processes in this new construction market landscape, companies must drastically modify their channel strategies to include a much more intense focus on the contractor and design build community in order to remain viable.
Doug Bevill is president of Construction Economics & Strategies, a sales and marketing firm specializing in helping building product manufactures grow their businesses in the new construction market landscape. Prior to starting his own firm, Doug was with F.W. Dodge/McGraw-Hill Construction for 18 years, and also spent 8 years with The Hager Companies, a global manufacturer of residential and commercial door hardware, as Executive Vice President, Chief Operating Officer and Chairman of Hager Asia. He can be emailed or called at 314-422-3177.
Wednesday, November 23, 2011
Why EMS USA uses a 10# polyurethane foam
Polyurethane insulation is used in panel construction all over the country for two reasons structural strength and built in R value. Most Insulted panels have a 3#-4# density polyurethane foam and this same standard has transferred over to insulated doors. Now why would we want to have a higher density foam door?
There are two reasons, one the higher the density the stronger the door is from a structural stand point. This means that the door is less apt to dent and can make a strong door leaf without added structural support in the door adding weight. The result is a light weight strong sliding or swinging freezer door.
The second benefit of 10# foam is its longevity. In the Polyurethane world everyone is concerned about the foam over time shrinking, this can cause the door or panel to separate from the metal skin, clearly shortening the life of the door. Additionally when shrinking occurs it allows pockets where moisture problems may occur. With a 10# door leaf the shrinkage over time is negligible and 10# foam will not absorb moisture, which has been tested and proven by German engineers.
Now why don’t more door companies make 10# door leaves? It is basically lack of technology as they have been unable to make a foam press that can handle the foam pressure.
The Engineers at EMS-USA Insulated Doors however have been able to master the process and have provided a superior door unlike anything on the European and US markets.
Thursday, November 17, 2011
Why polyurethane is a superior insulation
Why Polyurethane is the best Insulation for your cooler/freezer doors
Cold storage is something that people have been working to perfect for centuries and we've certainly come a long way. Rather than a root cellar we now have computerized cooling rooms with temperature control, electronic doors and solid cooling walls. But no matter how well a cooling room is built and equipped, without the right insulated cold storage door it will not perform as designed.
The Insulation of a door is critical to its performance. Polyurethane is a relatively new product, roughly around 50 years. Polyurethane was produced to replace the shortfalls of expanded polystyrene. Below are 5 reasons why Polyurethane is superior as insulation for your cooler/freezer doors.
R- Value - Polyurethane is the highest rated insulation in the world. Per inch of insulation it has no equal. Polyurethane is a closed-cell foam insulation material that contains a low-conductivity gas (usually hydro chlorofluorocarbons or HCFC) in its cells. Polyurethane has an R-Value OF R-7 to R-8 per inch.
Moisture Resistance - With all the problems of mold and mildew, moisture resistance is today a very important factor. Polyurethane has one of the lowest moisture permeability ratings of any product manufactured for the building industry today. Insulation materials made of rigid polyurethane foam (PUR/PIR) do not absorb moisture from the air. Due to their closed cell structure, they do not absorb or transport water, i.e. there is no capillary action.
Density - The density of a product will determine the strength of it. Polyurethane has a density of 2.2lb. (see the article why EMS Doors uses a 10# polyurethane foam)
Fire Resistance - The polyurethane is a UL Class 1 rated foam. This means that polyurethane is not a source for fire. On its own, polyurethane will not burn. When left on its own, it will extinguish itself. A Class 1 rating is the highest rating a building product can obtain. Also, polyurethane is a thermal-set plastic. This means, that it will not melt. Polyurethane is not affected until temperatures reach 1000 degrees and at that time it will only char. Polyurethane has a distinct advantage.
Chemical Resistance - Polyurethane is resistant to most counter chemicals.
Because polyurethane foam insulation is so effective, even under the most extreme environmental conditions, it reduces energy costs and related fossil fuel emissions. This is why polyurethane foam is the most common insulation used in doors for buildings with critical environments such as:
· Freezers and cold storage buildings
· Arctic climate buildings and test facilities.
· Clean rooms and food process structures
· Climate test structures
Even NASA is using Polyurethane in space shuttles as an insulation material!
Subscribe to:
Posts (Atom)